strong2024-10
Show HN: Data Formulator — 212 points, 34 commentsStrong initial reception for a Microsoft Research tool.
212 pts / 34 commentsHN community
AI-powered data visualization tool from Microsoft Research. Interactive AI agents iterate on chart design from raw data. 15.1K stars, MIT license, very active development.
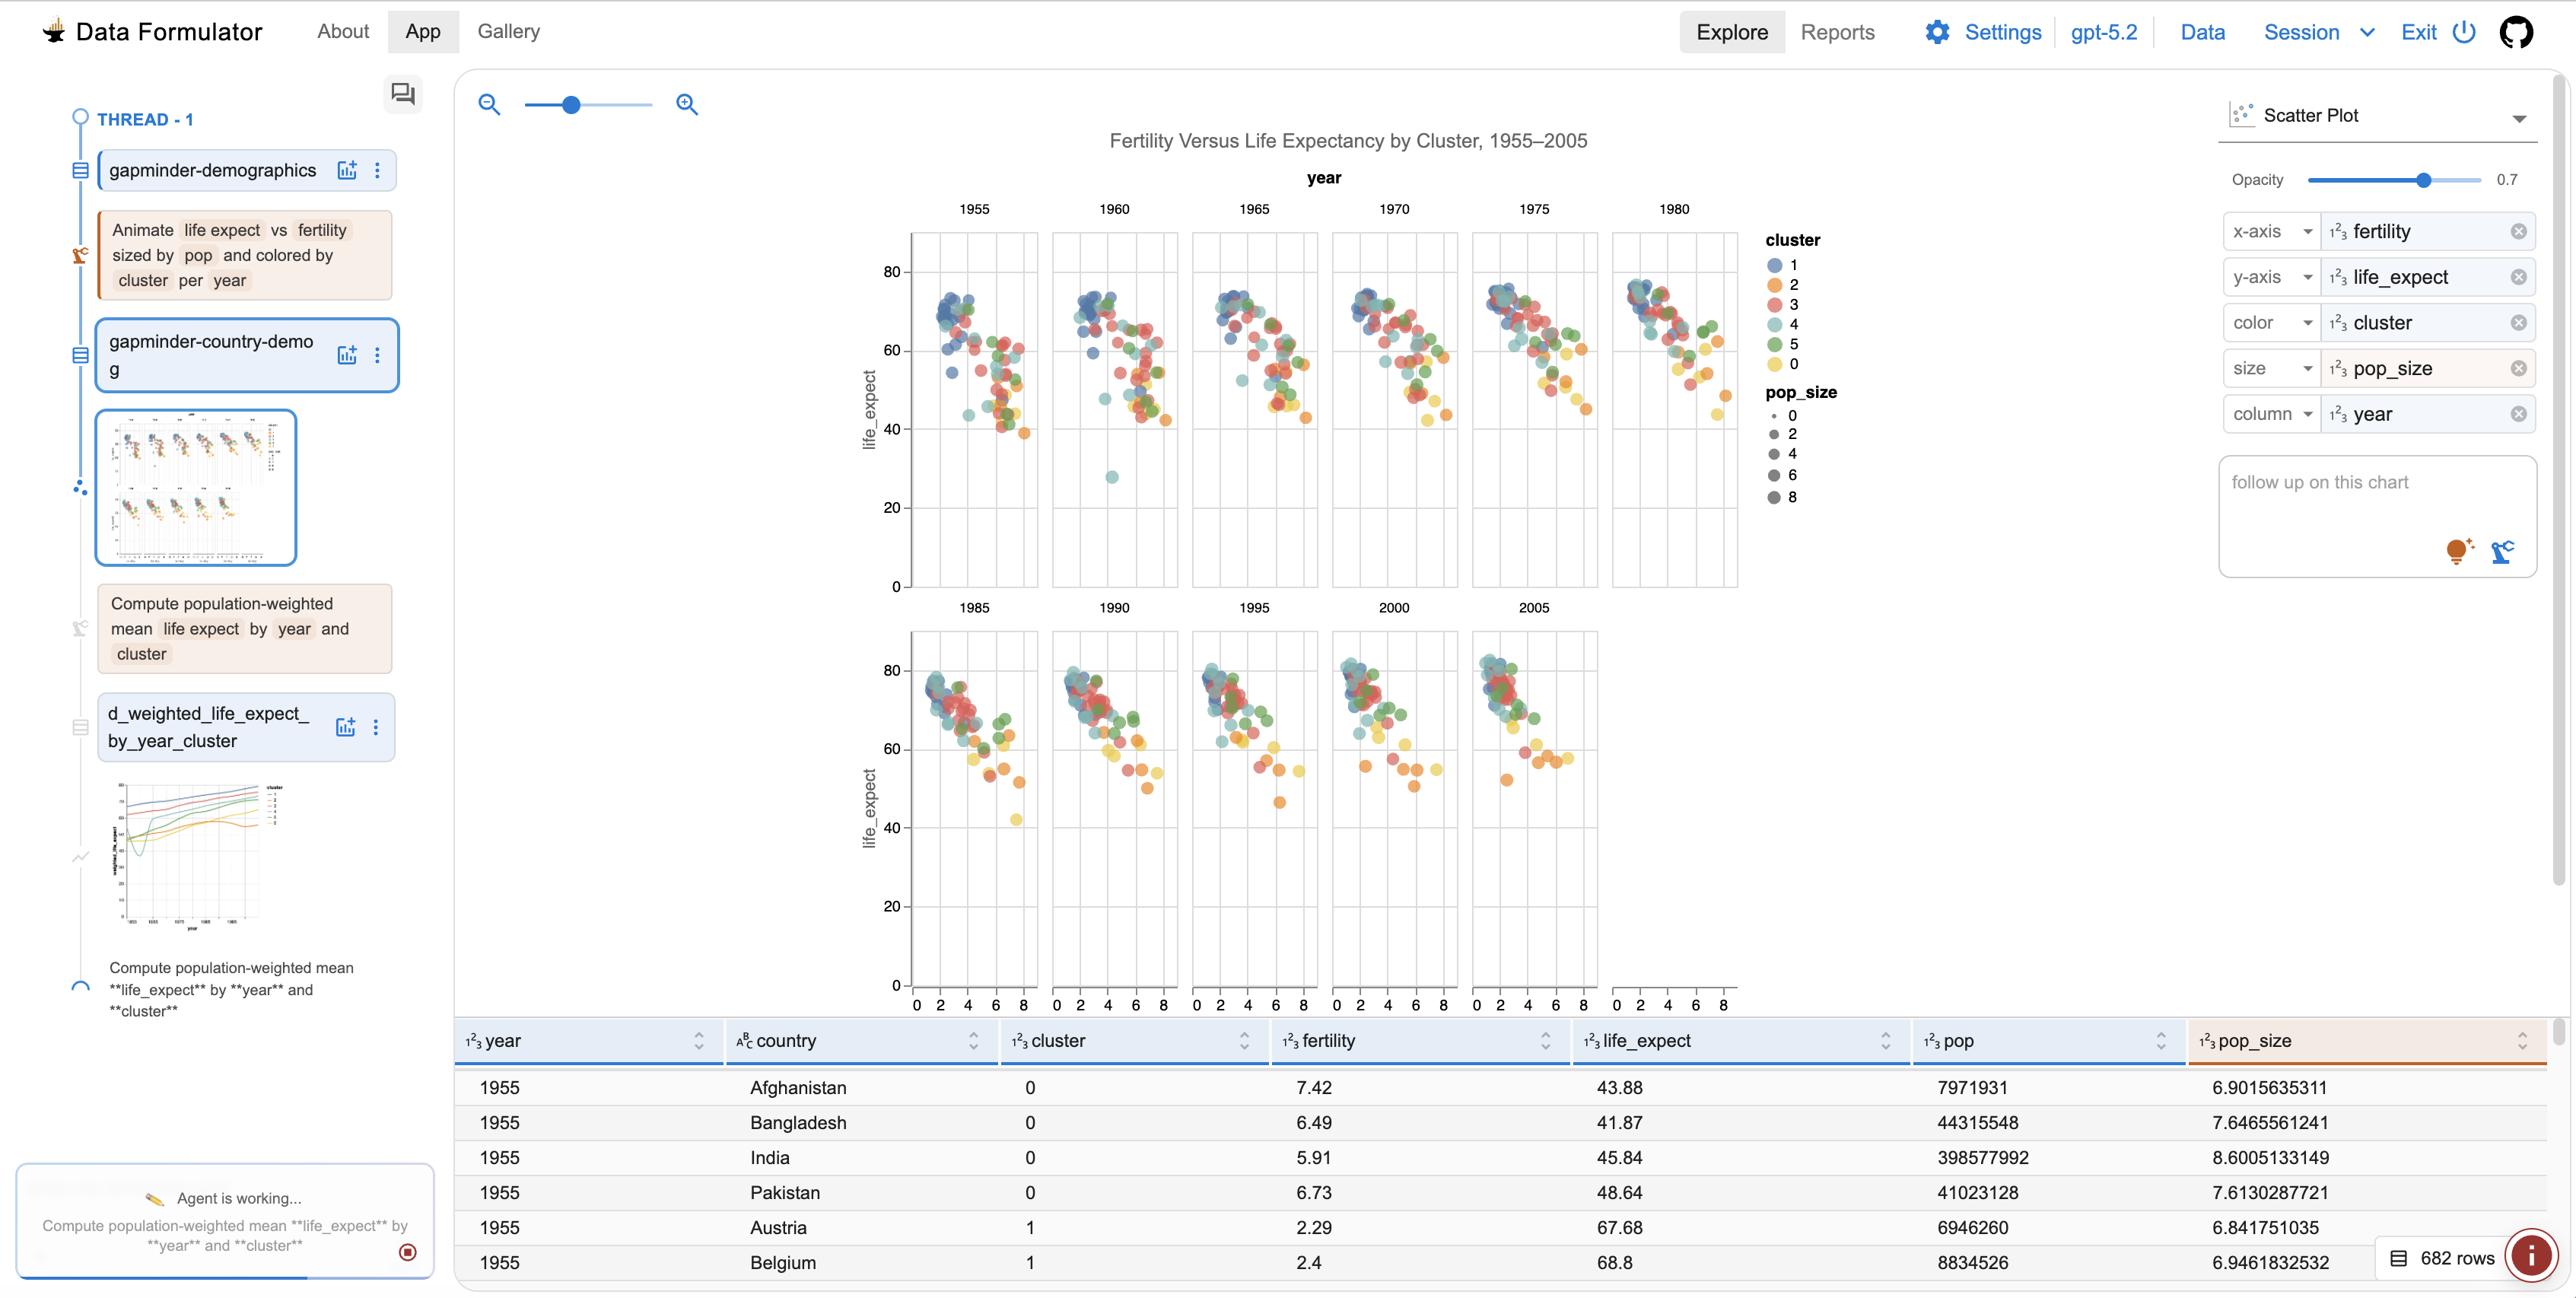
Where it wins
Microsoft Research backing with MIT license — best combo of institutional credibility and open access
Interactive AI agents for iterative data visualization — describe what you want, refine conversationally
Very active development (pushed day before ranking)
15.1K stars — strong community adoption for a research tool
Desktop application — runs locally, no cloud dependency
Bridges data prep and visualization in one tool
Where to be skeptical
Desktop-only — not a library you pip install
Smaller contributor base (27)
No deployment/sharing story — local analysis tool only
Editorial verdict
Best AI-powered data visualization tool — Microsoft Research quality, fully open source. Fills a niche no other tool covers: conversational, iterative chart building from raw data.
Source
Videos
Reviews, tutorials, and comparisons from the community.
Data Formulator Tutorial
Data Formulator Release Announcement
Related
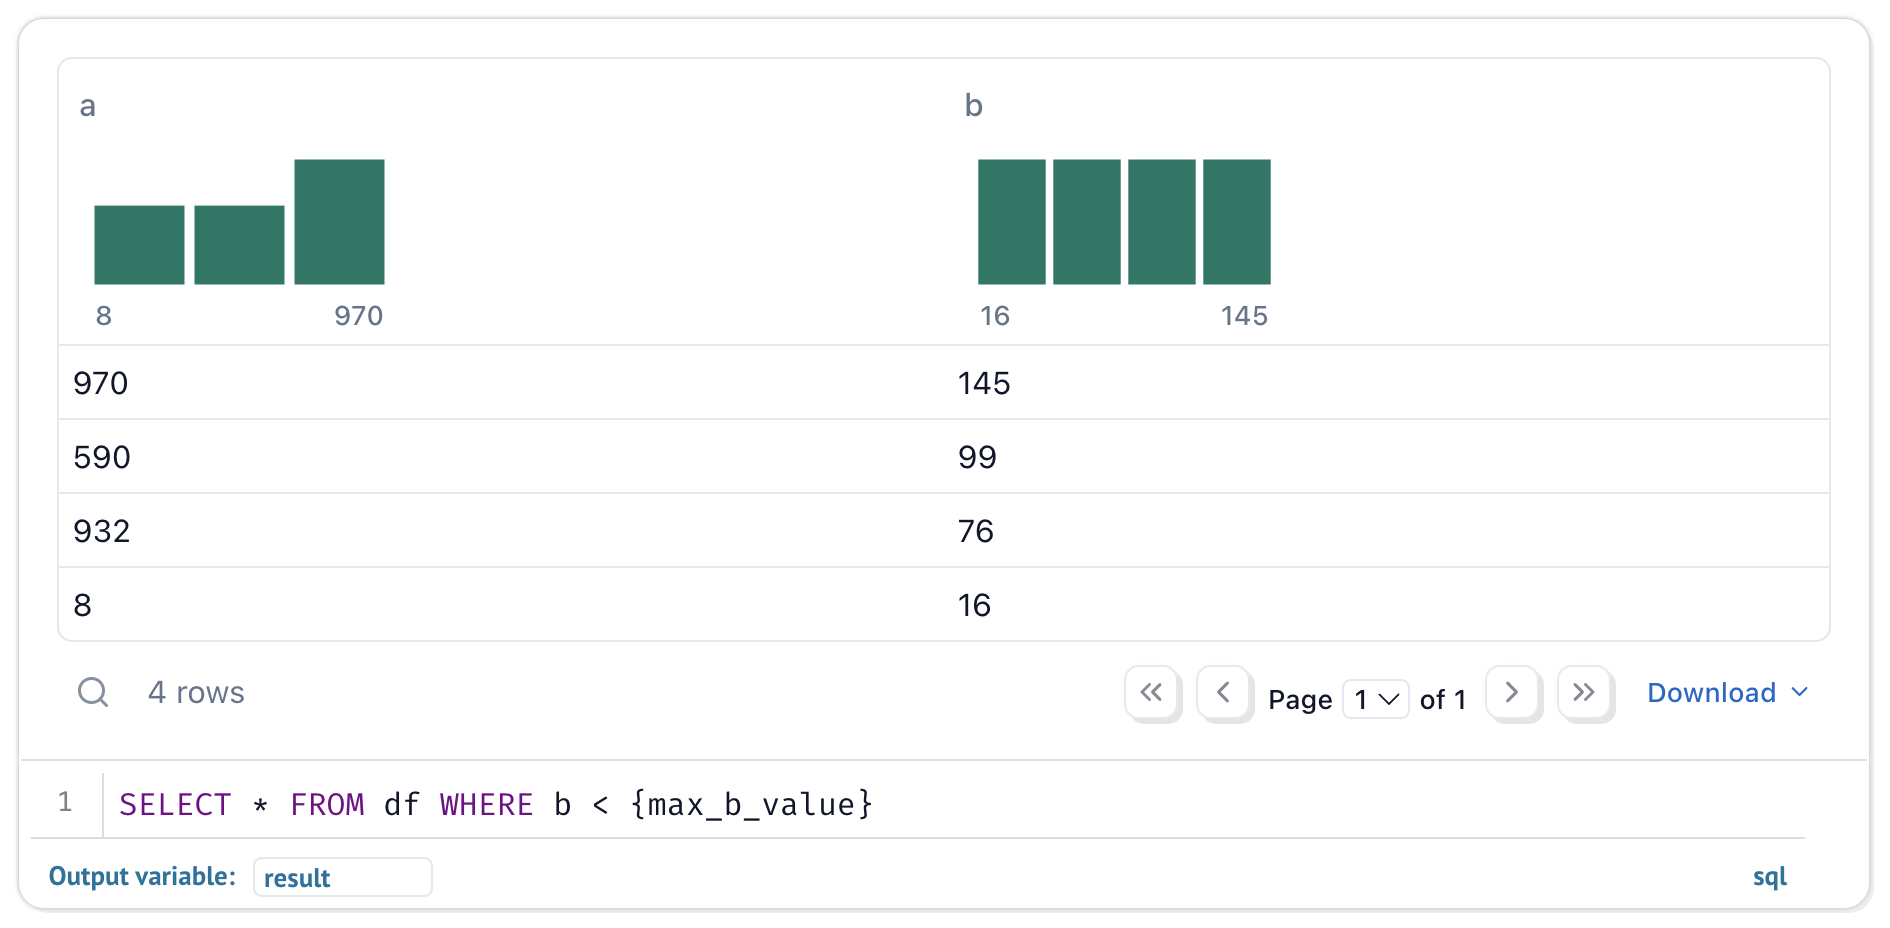
Marimo
93Reactive Python notebook that replaces Jupyter. Pure .py files, reactive DAG execution, dual-mode (notebook → app). 19.8K stars, 1.9M monthly PyPI downloads, 261 contributors.
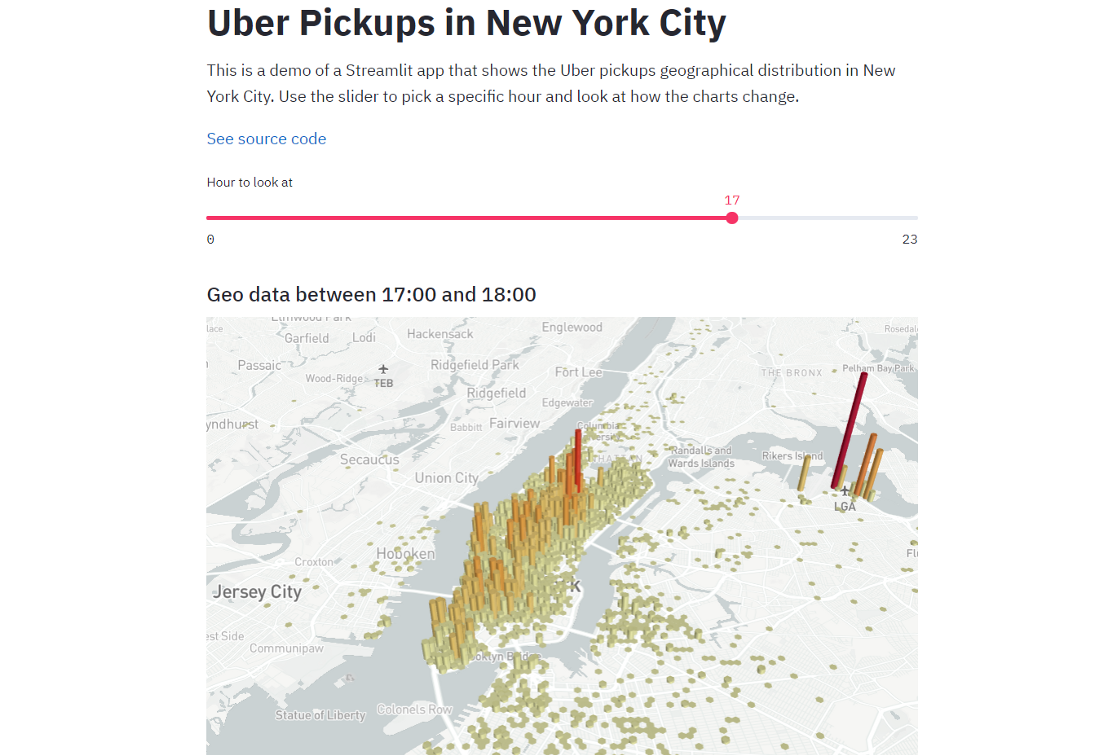
Streamlit
90The dominant Python data app framework. 44K stars, 31.8M monthly PyPI downloads, acquired by Snowflake for $800M. Ecosystem giant for deploying data apps — the standard answer for sharing Python analysis as a web app.
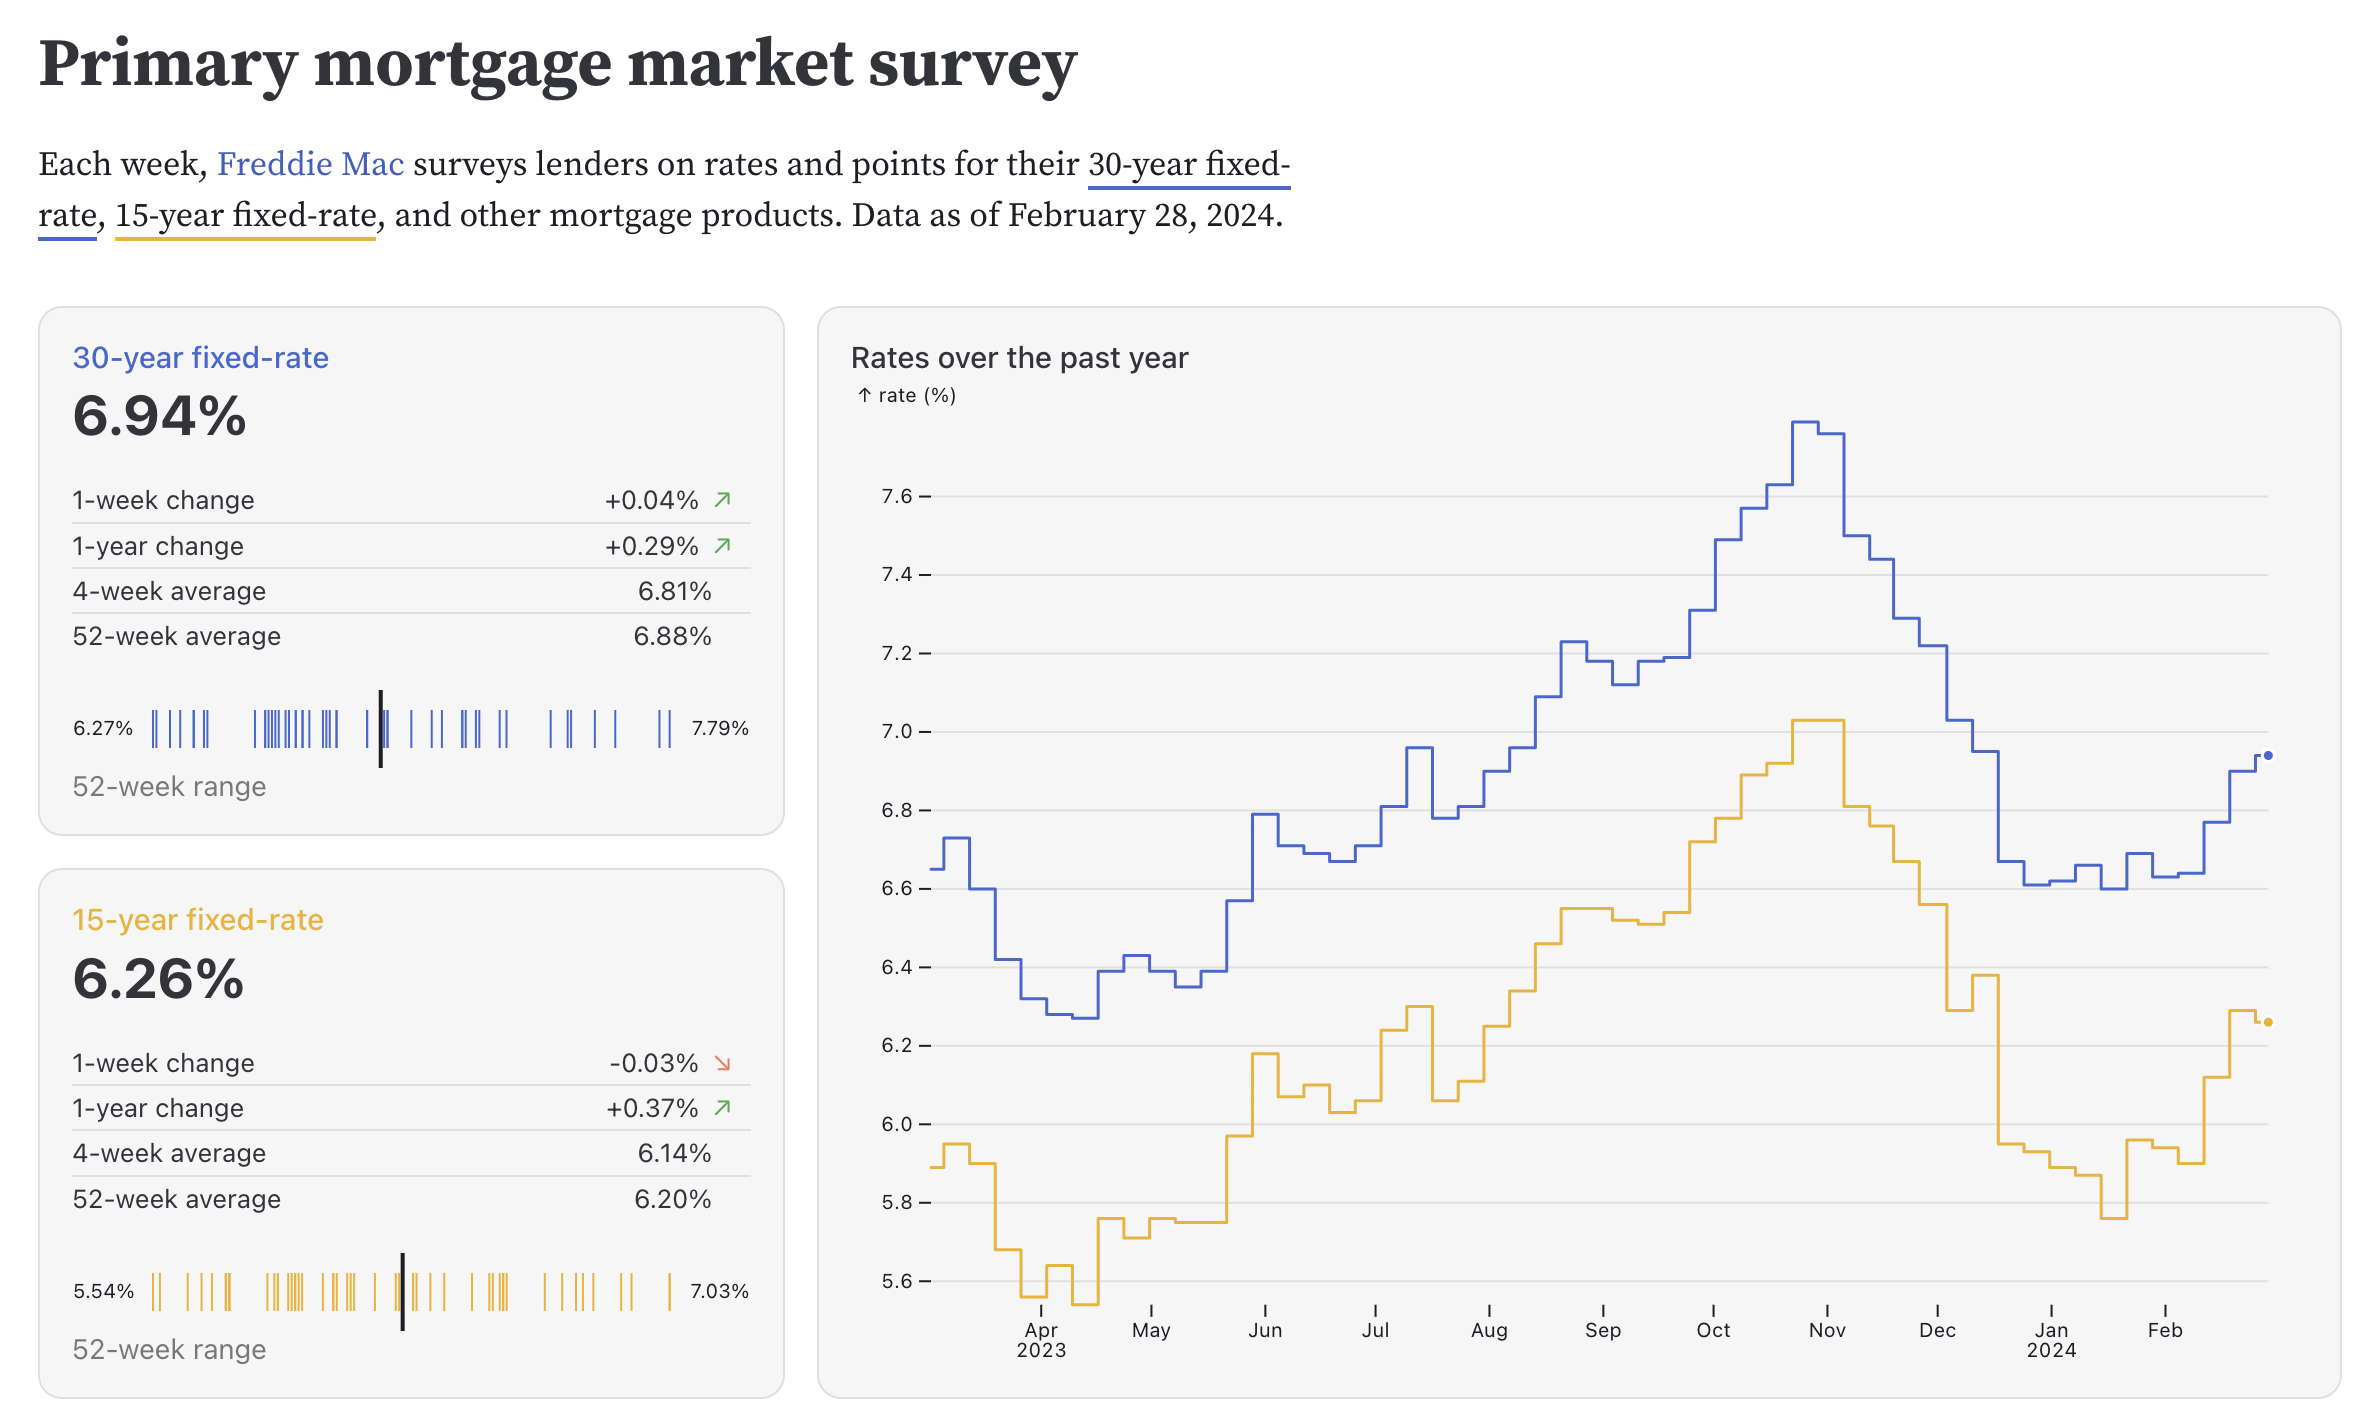
Observable Framework
84Static site generator for data apps with D3.js lineage. Full web dev power (HTML, CSS, JS, React). 3.4K stars, 16.7K npm monthly downloads, 360 pts on HN.
Evidence
78BI-as-code platform: SQL + Markdown → polished data reports. No JS/Python required. YC S21, 6K stars, 76 contributors. Git-versioned reports for SQL-first analysts.
Public evidence
Strong initial reception for a Microsoft Research tool.
Shows sustained development and continued community interest, though lower traction on repeat.
Raw GitHub source
Constrained peek so you can sanity-check the source material without leaving the site.
Working with data is hard for two simple reasons:
Data Formulator provides one visual workspace for exploring and analyzing data:
https://github.com/user-attachments/assets/8e4f8a08-6423-4227-a1f7-559e0126ce31
[!TIP] Love the charts? They're built on Flint. It's an open-source visualization language that compiles compact chart specs into polished visualizations.
[08-15-2026] Data Formulator 0.8 beta 1 (0.8.0b1) introduces:
Preview with
pip install --pre data_formulator==0.8.0b1oruvx data_formulator@0.8.0b1. Install the latest stable release (0.7) withpip install data_formulatoror run instantly withuvx data_formulator.
See the changelog for release details.
Here are milestones that lead to the current design:
DataAgent + Data Thread, refine 30+ chart types (semantic chart engine powered by Flint) with a style-refinement agent, and share as reports. Plus persistent sessions & workspaces and a multilingual (English/Chinese) UI.uvx data_formulator or uv pip install data_formulatorData Formulator is a Microsoft Research project for data exploration with visualizations powered by AI agents. It combines UI interactions with natural language so analysts can communicate intent, branch into alternative analyses, and share results — starting from any data format (screenshot, text, CSV, or database).
Play with Data Formulator with one of the following options.
CI builds self-contained Windows and macOS applications for pull requests and
every update to main. Download the latest archives from the Artifacts
section of the most recent
desktop builds workflow.
Workflow artifacts are retained for 30 days. Tagged builds are also attached
as permanent downloads to the corresponding
GitHub Release.
Extract the archive, then launch Data Formulator using the instructions for your operating system:
Data Formulator.exe. If Microsoft Defender SmartScreen
appears, select More info, verify that you downloaded the archive from
this repository, and then select Run anyway.Data Formulator.app to Applications. The first time you
open it, macOS may report that Apple could not verify the app. Open
System Settings → Privacy & Security, scroll to Security, and select
Open Anyway for Data Formulator. Confirm by selecting Open when
prompted.[!WARNING] These are automated preview builds and are not currently code-signed or notarized. Only bypass the operating-system warning when the archive was downloaded directly from this repository's workflow artifacts or releases.
Option 1: Install via uv (recommended)
uv is an extremely fast Python package manager. If you have uv installed, you can run Data Formulator directly without any setup:
uvx data_formulator
Run uvx data_formulator --help to see all available options, such as custom port, sandboxing mode, and data storage location.
Option 2: Install via pip
Use pip for installation (recommend: install it in a virtual environment).
pip install data_formulator # install
python -m data_formulator # run
Data Formulator will be automatically opened in the browser at http://localhost:5567.
Option 3: Run with Docker
docker compose up --build